Austria’s Covid legislation: Duration of parliamentarian consultation period in comparison.
Austria
Corona
pdftools
A (relative) deep dive into the length of the public consultation period for draft bills in Austria, and whether three days for three pages are actually ‘normal’.
Author
Roland Schmidt
Published
20 Feb 2021
1 Context
This is an addition to my previous posts on COVID related legislation in Austria.
Over New Year (!), the Austrian government introduced another bill with the aim to get a grip on the COVID pandemic. With the speed with which things have been developping and the flurry of hard/soft/de facto lockdowns, I have to confess that I would have to look into the text to recall the changes introduced by bill 88/ME (XXVII) (in full: ‘Epidemiegesetz, COVID-19-Maßnahmengesetz, Änderung’). However, what made the bill memorable even during these times was its legislative genesis, with the government limiting the public consultative process to only three days. As mentioned in previous posts, Austria’s legislative procedure includes a public consultation process which allows citizens, NGOs, churches etc. to file submissions in which they can raise concerns and provide feedback on the draft law. At least in theory, it’s a feedback loop which allows the government to solicit input and revise its bills.
Unsurprisingly, at least to me, the government was harshly criticized for this short consultation period and accused of rendering any meaningful consideration impossible. I am no expert on the legislative process, but a quick Google search led me to a circular from 2008 in which the Chancellery’s own constitutional service urged ministries to provide a consultative period of at least six weeks. In contrast, some pointed out that the bill had only three pages and that - in light of the urgency due to a pandemic - three days should suffice to read and comment on the bill.
This debate made me wonder how long other bills were open for the consultative process and how bill 88/ME (XXVII) would compare, also when considering their documents’ lengths. To answer these questions, I a) extracted from the parliament’s website the start and end dates of all bill’s consultative period since 1975, as published on the parliament’s website. Based on these dates I calculated the length of the consultative process; b) downloaded the text of all pertaining bills and retrieved their number of pages. Putting the length of the consultation process and the length of the bill together should allow to better evaluate the three day notice for the amendment to the epidemic bill.
I’ll first present the results and other stuff I found noteworthy, and then focus on some of the required steps in R to obtain them. The raw dataset containing the consolidated results is here.
2 Results
2.1 Number of submissions
Code
pl_submissions_per_bill<- df_consolidated %>%mutate(bill_indicator=case_when(str_detect(title, "Epidemie") & legis_period=="XXVII"~"yes",TRUE~as.character("no"))) %>%ungroup() %>%ggplot()+labs(title="LEGISLATIVE CONSULTATION PROCESS:\nNumber of filed submissions per bill.",subtitle="Note log scale of y-axis.",x="Date",y="Number of submissions (log scale)",caption=caption)+geom_segment(aes(x=as.Date("2017-01-01"),xend=as.Date("2017-01-01"),y=0,yend=4000),color="grey50")+geom_text(label=str_wrap("Introduction of possibility to file electronic submissions via parliament's website",30),aes(x=as.Date("2016-06-01"),y=6000),color="grey50",lineheight=0.7,check_overlap = T,hjust=1,vjust=1,size=3,family="Roboto condensed")+geom_jitter_interactive(aes(x=date_end_max,y=n_obs_submissions,tooltip=glue::glue("{str_wrap(title, 40)} Number of submissions: {n_obs_submissions} Bill ID: {bill_id}/{legis_period}, Click to open submission page"),onclick=paste0('window.open("', link_single_bill_page, '#tab-Stellungnahmen', '")'),color=bill_indicator))+geom_text(label=str_wrap("Epidemiegesetz, COVID-19-Maßnahmengesetz, Änderung (88/ME)", 40),aes(x=as.Date("2021-01-01"),y=19000),color="firebrick",lineheight=0.7,check_overlap = T,hjust=1,size=3,family="Roboto Condensed")+scale_x_date(breaks=c(seq.Date(as.Date("1990-01-01"), as.Date("2020-01-01"), by="10 year"), as.Date("2017-01-01"),as.Date(min(df_consolidated$date_end_max))),date_labels ="%Y" )+scale_y_log10(labels=scales::label_comma(accuracy=1),limits=c(1, 20000))+scale_color_manual(values=c("yes"="firebrick","no"="grey50"),labels=c("yes"="Covid-19 related bills","no"="other"))+guides(color=guide_legend(reverse=T))+theme_post()+theme(plot.title.position ="panel",legend.position ="top",legend.direction ="horizontal",legend.justification ="left",legend.title =element_blank(),axis.title.x =element_text(hjust=0,color="grey30"),axis.title.y=element_text(hjust=0, color="grey30",angle=90))pl_submissions_per_bill <-girafe(ggobj = pl_submissions_per_bill,height_svg =5,options =list(opts_toolbar(saveaspng =FALSE),opts_tooltip(css = glue::glue("background-color:{plot_bg_color}; line-height:100%; color:black; font-size:80%; font-family:'Roboto Condensed';)")) ))
To start with, let’s have a look at the number of submissions filed during the consultation process per bill. The plot below shows quite clearly that bills related to Covid triggered record breaking numbers of submissions. Apart from the three latest Covid bills, only the two drafts related to security issues (‘Sicherheitspolizeigesetz’) with around 9,000 submissions were within a similar level. To get details, hover over the dots. Note that the y-axis is log-scaled to keep the variation among bills with fewer submissions visible.
2.2 Duration of consultation process and length of bills
But what about the initial question? How unusual is it that a bill of three pages length, i.e. bill 88/ME (XXVII), is open for consultation for only three days? The plot below addresses this question. As the orange dot in the graph below highlights, there has never been another bill with three pages and as little as three days of consultation. The next bills in the same page-length category had eight days (among them a bill amending the law on gambling/Glückspielgesetz…). So at least from this perspective, the consultation period for bill 88/ME was quite an aberration.
However, if we broaden our view a bit, and also consider bills with fewer or more than three pages, we see that there were several other bills for which consultation periods shorter than three days were granted.
Code
caption_note <-"Note: Each dot represents a specific bill of x pages and y days available for filing a submission as part of the public consultation process. Dots within the same rectangle have the same page - duration combination. Random variation was added to avoid overplotting of dots. Only bills with max 10 pages and max 20 days consultation period are shown. See blog post for details."pl_length_duration <- df_consolidated %>%filter(duration_collected<21) %>%filter(duration_collected>0) %>%filter(pdf_pages_sum<11) %>%mutate(pdf_pages_sum_fct=forcats::fct_inseq(as.character(pdf_pages_sum))) %>%mutate(duration_collected_fct=fct_inseq(as.character(duration_collected)) %>%fct_rev()) %>%ggplot()+labs(title="Duration of consultation process and length of considered bills:",subtitle ="",caption=glue::glue("{str_wrap(caption_note, 125)} {caption}"),x="Number of bill's pages",y="Number of days to file a submission")+geom_jitter_interactive(aes (x=pdf_pages_sum_fct,y=duration_collected_fct,color=covid_measures_bill,tooltip=glue::glue("Name of bill: {stringr::str_trunc(title, width=25, side=c('right'))}, Legislation period: {legis_period}, Bill ID: {bill_id} pages: {pdf_pages_sum} consultation duration: {duration_collected} link: <a href={link_single_bill_page}>Click to open</a>"),onclick=paste0('window.open("', link_single_bill_page , '")'))) +scale_color_manual(values=c("COVID-19-Maßnahmengesetz"="orange", "other"="grey50"),labels=c("COVID-19-Maßnahmengesetz"="Epidemiegesetz ME88/XXVII","other"="other"))+facet_grid(duration_collected_fct ~ pdf_pages_sum_fct,drop=F,switch="both",scales="free")+theme_post()+theme(panel.spacing.x =unit(0, "cm"),panel.spacing.y =unit(0, "cm"),panel.grid.major.x =element_blank(),panel.grid.major.y =element_blank(),strip.text.y.left =element_text(angle=0,vjust=0.5,hjust=1,color="grey30",face="plain"), #.left neededstrip.text.x.bottom =element_text(angle=0,hjust=0.5,color="grey30",face="plain"), #.left neededlegend.position ="top",legend.direction ="horizontal",legend.justification ="left",legend.title =element_blank(),axis.title.x =element_text(hjust=0,color="grey30"),axis.title.y=element_text(hjust=0, color="grey30",angle=90),axis.text.x =element_blank(),axis.text.y =element_blank(),panel.border =element_rect(color ="black", fill =NA, size = .2))pl_length_duration <-girafe(ggobj = pl_length_duration,height_svg =5,options =list(opts_toolbar(saveaspng =FALSE),opts_tooltip(css = glue::glue("background-color:{plot_bg_color}; line-height:100%; color:black; font-size:80%; font-family:'Roboto Condensed';)")) ))
Nevertheless, out of the 3683 bills open for consultation, 3527 featured longer consultation periods than three days. There were only 47 bills with three or fewer days (excluding results with negative duration or incomplete start/end dates due to errors in the data source, see here).
Code
pl_consolidated <- df_consolidated %>%filter(duration_collected>=0) %>%#remove those with negative durationcount(duration_collected<=3) %>% janitor::clean_names() %>%mutate(duration_3=as_factor(duration_collected_3)) %>%ggplot()+labs(title="Number of bills with three or fewer days of consultation period",subtitle="Bill 88/ME XXVII amending the 'law on epidemics' was open for consultation for three days. \nHow many other bills had a similar or shorter consultation period?",y="Number of bills",x="Length of consultation period",caption=glue::glue("{caption}\nAnalysis excluded {nrow(df_duration_mult %>% filter(if_any(starts_with('date'), is.na)))+nrow(df_duration_collected %>% filter(duration_collected<0))} bills with errors in the data source. See blog for details.") )+geom_bar(aes(x=duration_3,y=n,fill=duration_3),stat="identity",position=position_dodge(width=0.9))+geom_text(aes(x=as.numeric(duration_3)-(.5*.9),y=n,label=n),# position=position_dodge(width=0.9),size=10,color="grey30",vjust=0,hjust=0)+scale_x_discrete(labels=c("FALSE"="more than 3 days","TRUE"="3 days or fewer"),expand =expansion(mult=c(0,0.1)))+scale_y_continuous(labels=scales::label_comma(),limits=c(0,NA),expand=expansion(mult=c(0,0.1)))+scale_fill_manual(values=c("FALSE"="grey30","TRUE"="orange"))+theme_post()+theme(legend.position ="none",axis.text.x =element_text(color="grey10"),axis.title.y =element_text(color="grey30",angle=90,vjust=1,hjust=0),axis.title.x =element_text(color="grey30",# angle=90,# vjust=1,hjust=0))
2.3 Overview table
If you are interested in the details pertaining to each bill, the table below provides them. Note that for the sake of completeness this table also includes those bills for which I retrieved impossible/wrong duration data (see here for details.) However, the latter were excluded from the analysis.
Code
#table.starttb_consolidated
Code
#table.end
2.4 Duration of consultation process per leigslative period
With the data available I started to wonder whether there are actually any considerable differences between different legislative periods/governments and the lengths of their bills’ consultation processes. To further contrast the lengths, I added the requested minimum duration of six weeks as raised in the 2007 circular of the Chancellery’s constituitonal service.
The plot provides below shows the distribution of consultation periods’ length (in days) per legislative period. The horizontal line indicates the recommended length of six weeks.
Code
pl_duration_legis_period<- df_consolidated %>%filter(duration_collected>=0) %>%mutate(legis_period_fac=as.roman(legis_period) %>% as.integer %>%as.character() %>%fct_inseq()) %>%ungroup() %>%ggplot()+labs(title="Distribution of length of consultative periods.",subtitle="Red dot indicates median value.",x="legislative period",y="duration in days",caption=caption) +geom_violin(aes(x=legis_period_fac,y=duration_collected),fill="grey50",color="grey50" )+geom_hline(yintercept=6*7,linetype="dotted",color="grey50")+geom_text(label="requested six\nweek duration\n(42 days)",y=6*7+5,x=length(unique(df_consolidated$legis_period))+1,color="grey50",vjust=0,hjust=0,size=3,lineheight=0.7,family="Roboto Condensed",check_overlap = T)+geom_point_interactive(data=. %>%group_by(legis_period_fac) %>%summarise(duration_collected_median=median(duration_collected, na.rm = T)),aes(x=legis_period_fac,y=duration_collected_median,group=legis_period_fac,tooltip=glue::glue("Median duration of consultative period: {duration_collected_median}") ),color="firebrick")+scale_color_manual(label=c("firebrick"="median length of consultative period"),values=c("firebrick"="firebrick"))+scale_x_discrete(labels =function(x) as.roman(x),expand=expansion(mult=c(0.05,.3)))+scale_y_continuous(breaks=c(seq(0, 400, 100), 42))+coord_cartesian(ylim=c(0, 400))+#set limits here and not in scale_y to zoom intheme_post()+theme(plot.title.position ="panel",legend.position ="top",legend.direction ="horizontal",legend.justification ="left",legend.title =element_blank(),axis.title.x =element_text(hjust=0,color="grey50"),axis.title.y=element_text(hjust=0, color="grey50",angle=90))pl_duration_legis_period <-girafe(ggobj = pl_duration_legis_period,height_svg =4,options =list(opts_toolbar(saveaspng =FALSE),opts_tooltip(css = glue::glue("background-color:{plot_bg_color}; line-height:100%; color:black; font-size:80%; font-family:'Roboto Condensed';)")) ))
3 Analysis in R
In the following section I’ll highlight the most important steps how to retrieve the results from above.
3.1 Getting the duration of the consultation period
3.1.1 Get links to all bills
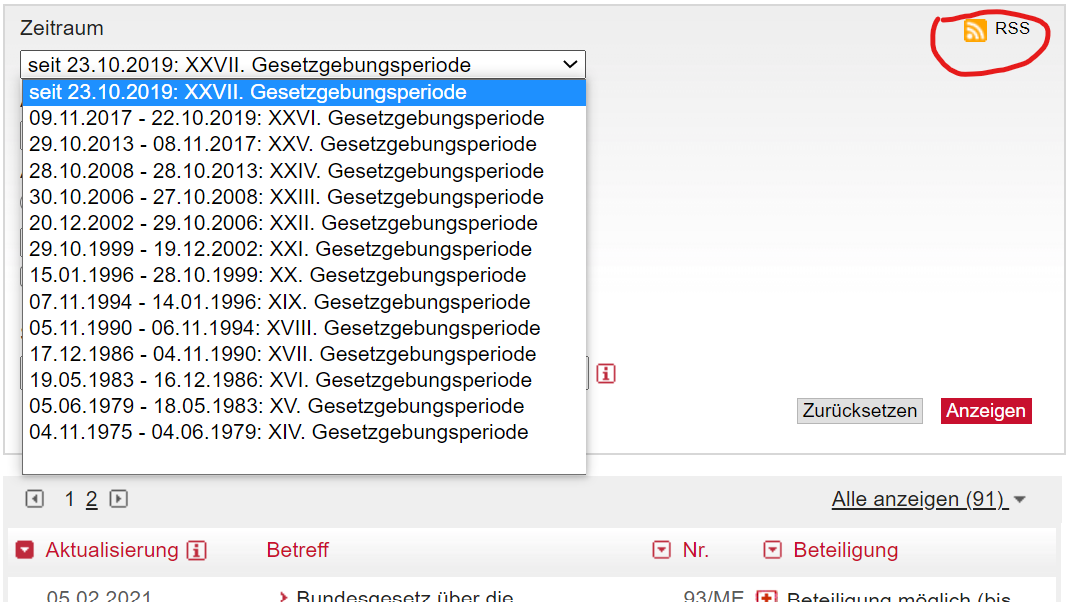
To get the required data I start with retrieving data on each bill’s title, its date and a link eventually leading us to each bill’s details on the different steps in the legislative process. To get these data, I make use of the rss-feed provided on the parliament’s website (see here to extract the data.
First, I define the function fn_get_bill_overview.
Code
fn_get_bill_overview <-function(rss_feed){ df_rss <- xml2::read_xml(rss_feed) data <-xml_child(df_rss, 1) df_bill_pages_link <- data %>% xml2::xml_find_all("//link") %>%html_text() %>%enframe(., name="id",value="link_single_bill_page") %>%mutate(link_single_bill_page=str_squish(link_single_bill_page)) %>%filter(id>2) #removes first two rows which don't include data on bills#get title df_bill_pages_name <- data %>% xml2::xml_find_all("//title") %>%html_text() %>%enframe(., name="id",value="title") %>%mutate(title=str_trim(title)) %>%filter(id>2) #get publication date df_bill_pages_pub_date <- data %>% xml2::xml_find_all("//pubDate") %>%html_text() %>%enframe(., name="id",value="date") %>%mutate(date=date %>%str_squish() %>% lubridate::dmy_hms(., tz="Europe/Vienna"))#combine to one dataframe df_bill <-bind_cols( df_bill_pages_name, df_bill_pages_pub_date, df_bill_pages_link, ) %>%select(-contains("id")) df_bill %>%mutate(indicator_me_numeric=str_extract(link_single_bill_page, regex("(?<=_)\\d*"))) %>%mutate(indicator_me=glue::glue("{as.numeric(indicator_me_numeric)}/ME")) %>%mutate(rss_link_submissions=glue::glue("https://www.parlament.gv.at/PAKT/VHG/XXVII/ME/ME_{indicator_me_numeric}/filter.psp?view=RSS&jsMode=&xdocumentUri=&filterJq=&view=&GP=XXVII&ITYP=ME&INR={as.numeric(indicator_me_numeric)}&SUCH=&listeId=142&FBEZ=FP_142"))}
Then I apply this function to all the links of the rss feeds for the different legislative periods. As you can see in the image above, the parliament’s website provides data for the XIV to the XXVII legislative period. Since the roman number of the period forms part of the rss-link, I make use of the as.roman function which let’s us easily iterate over the sequence from 14 to 27.
Code
#link to rss feeds of all available legislative periodperiods <-as.roman(seq(14, 27, 1)) #freaking nicerss_links <- glue::glue("https://www.parlament.gv.at/PAKT/MESN/filter.psp?view=RSS&jsMode=&xdocumentUri=&filterJq=&view=&GP={periods}&MESN=ME&R_MESN=ME&MIN=ALLE&SUCH=&listeId=102&FBEZ=FP_002")#apply functiondf_bills_all <- rss_links %>% purrr::set_names() %>%map_dfr(., fn_get_bill_overview, .id="rss_links")
The result is a data frame providing us with some basic information on each bill, but more importantly, a link to each bill’s overview page (link_single_bill_page) and page with submissions filed during the consultiatve period (rss_link_submisison).
The overview page of each bill contains a table which details the bill’s different stages in the legislative process as well as links to the text of the bill open for consultation. It is here where we can retrieve the start and the end date of the consultation process, and subsequently calculate the process’ duration. We can also get the links to download the bill’s file(s) and subsequently extract their page numbers.
To do so I constructed the function fn_consult which reads the content of the overview table with the rvest package. I’ll explain the function in two parts:
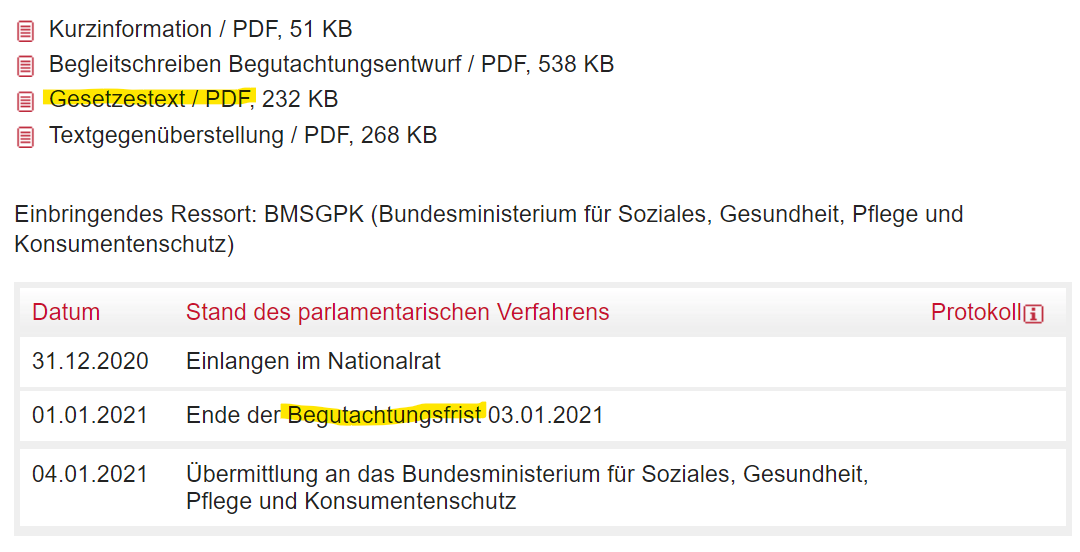
First, to get the start and end date, I keep (filter) only those rows which include the word ‘Begutachtungsfrist’ (consultation deadline). From this row we can further extract the start and end date.
Second, to eventually get the text of the bills, the function extracts those weblinks which include ‘Ministerialentwurf’ (ministrial draft) and the file suffix ‘pdf’, or ‘Gesetzestext’ (law text) or ‘Entwurf’ (draft) in their text. The xpath argument of the rvest::html_node function allows for regex expressions what is just… beautiful. These links will be later used to download the bills and extract their number of pages.
Third, apply the function to all links.
Code
#function to extract details (duration and pdf links) from bills' overviewfn_consult <-function(link_bill) {#1) GET ROWS WITH START AND END DATES OF CONSULTATION PERIOD df_consultation_dates <- link_bill %>%read_html() %>%html_nodes("#content > div.contentBlock.tabs-responsive__contentBlock > div:nth-child(2) > table") %>%html_table() %>%map_df(., bind_rows) %>% janitor::clean_names() %>%filter(str_detect(stand_des_parlamentarischen_verfahrens, regex("Begutachtungsfrist"))) %>%#Identifier to select rows with datesrename(date_start=datum) %>%mutate(date_end=str_extract(stand_des_parlamentarischen_verfahrens, regex("\\d{2}\\.\\d{2}\\.\\d{4}"))) %>%#extract number for datesselect(-protokoll) #2) GET LINKS TO PDFS OF DRAFT BILLSdf_link_text <- link_bill %>%read_html() %>%html_nodes(xpath="//a[contains(text(), 'Ministerialentwurf') and contains(text(), 'PDF') or contains(text(), 'Gesetzestext') or contains(text(), 'Entwurf')]") %>%#works! case sensetivehtml_attr("href") %>% tibble::enframe(name=NULL, value="link_bill_pdf") %>%mutate(link_bill_pdf=paste0("https://www.parlament.gv.at/", link_bill_pdf))bind_cols(df_consultation_dates, df_link_text) %>%select(text_raw="stand_des_parlamentarischen_verfahrens", date_start, date_end, link_bill_pdf)}#3 APPLY FUNCTION AND CREATE A TIBBLEtbl_missing <-tibble(link_single_bill_page=NA_character_, text_raw=NA_character_, date_start=NA, date_end=NA, link_bill_pdf=NA_character_)library(furrr)plan(multisession, workers =2) #to speed up process, use multicore#wrap function with 'possibly' to be on the safe side;df_res <- df_bills_all$link_single_bill_page %>% purrr::set_names() %>%future_map_dfr(., possibly(fn_consult, otherwise=tbl_missing), .id="link_single_bill_page",.progress=T) %>%select(link_single_bill_page, text_raw, date_start, date_end, link_bill_pdf) #house keeping; add legislative period and bill id;df_res <- df_res %>%mutate(across(.cols=contains("date"), lubridate::dmy)) %>%mutate(legis_period=str_extract(link_single_bill_page, regex("[^/]*?(?=/ME/)"))) %>%mutate(bill_id=str_extract(link_single_bill_page, regex("ME_.*?(?=/)"))) df_res <- df_res %>%left_join(., df_bills_all %>%select(link_single_bill_page, title))
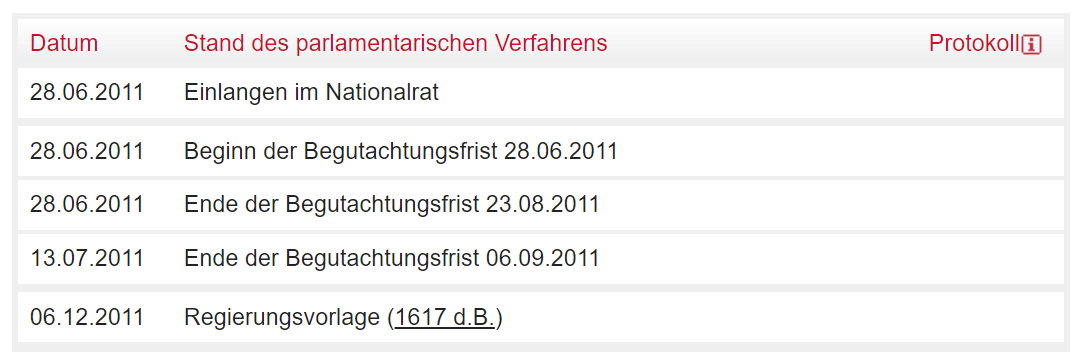
The resulting dataframe is already an important building block, but we’re not yet there. A few potential pitfalls have to be controlled for: When a bill has more than one link to the bill’s text, our function provides us with multiple observations (rows). This has to be controlled for when aggregating the consultation period’s overall duration (i.e. duplicates should not be summed up). On the other hand, there are bills in which the consultation period was extended. As a consequence we obtained multiple rows with start and end dates for one distinct bill.
Code
#remove dupes due to multiple pdf documentsdf_duration <- df_res %>%distinct(link_single_bill_page, text_raw, date_start, date_end, legis_period, bill_id, title)df_duration_mult <- df_duration %>%group_by(link_single_bill_page, legis_period, bill_id, title) %>%mutate(n_obs_duration=n()) %>%ungroup()#take each bill's earliest (minimum) start date and and latest (maximum) end date to calculate the overall duration of the consultation period;df_duration_collected <- df_duration_mult %>%filter(!is.na(date_start) &!is.na(date_end)) %>%#remove those with missing datesgroup_by(link_single_bill_page, legis_period, bill_id, title) %>%summarize(date_start_min=min(date_start, na.rm = T),date_end_max=max(date_end, na.rm = T),n_obs_duration=mean(n_obs_duration),dates_collected=paste(paste(as.character(date_start), "to", as.character(date_end)),collapse="; ")) %>%mutate(duration_collected=date_end_max-date_start_min+1) %>%ungroup()
The example below illustrates the issue of multiple consultation periods.
Here’s how the case is included in the data table above:
The data obtained by now is essentially the outcome presented in the table above. There were however some results which were incomplete or plainly wrong. I think it’s important to highlight that these observations were excluded from the results presented in the first section.
There were 23 bills where no start or end date was provided:
There were also 109 bills where start and end dates were provided, but they effectively meant a negative duration. As far as I can tell, the reason behind these erroneous results are either due to obviously wrong data entries or an inconsistency in the data representation (and subsequently wrongly extracted data).
Overall, there were 132 cases in which the obtained duration was not helpful and eventually omitted from the further analysis. With a bit more time, one could go through these cases and correct the errors.
3.4 Getting the length of the bills
The second part of the analysis required the extraction of the number of pages per bill. Embarking from our initial dataframe df_res which included already the links to all submission pdfs, we can construct file names (file_name) and a download destination.
Code
df_pages <- df_res %>%select(link_single_bill_page, link_bill_pdf, legis_period, bill_id, title) %>%distinct() %>%#remove duplicatesfilter(link_single_bill_page %in% df_duration_collected$link_single_bill_page) %>%#only for those where we have valid durationsmutate(file_name=str_extract(link_bill_pdf, regex("[^\\/]*pdf$"))) %>%mutate(file_name=glue::glue("{legis_period}_{bill_id}_{file_name}")) %>%mutate(download_destination=glue::glue("{here::here('posts', '2021-01-22-covidconsultationduration', 'bills_pdf')}/{file_name}") %>%as.character() %>%str_trim(., side=c("both")))
With the purrr:walk2 function we can take 1) the links to the files (link_bill_pdf) and the 2) download destination (download_destination) as inputs and feed them to the download function which I additionally wrapped with the safely adverb. Since there is a considerable number of documents to download, this may take a while (a few hours).
To eventually extract the number of pages from each document, I make once again use of the wonderful pdftools package. Mapping each downloaded file to pdftools’ pdf_info function gives us a list including the number of each document’s pages. Similar to the calculation of a consultation period’s length, we also have to account for bills which comprise multiple documents and, in these cases, have to aggregate them to a total number of a bill’s page.
As so often, the above presented results - as insightful as they may (or may not) be - are only stepping stones and further improvements are definitely possible. One obvious step for ‘fine-tuning’ could be to correct the duration of the consultation period for the number of actual working days. As of now, there is no differentiation between working and non-working days. Another, possible avenue could be not to take the number of pages of a bill, but the number of characters as an indicator for the document’s length. This step would require to OCR the entire text of all bills. While this ‘technically’ not a big deal (again thanks to the pdftools package), it is rather time consuming endeavor (at least on my laptop; after 36 hours I interrupted the process). Having said this, though, I am not sure how much different the results would actually look like and whether its really worth the effort.